In part one of this analysis, we posed the question: Outside of other vehicles, what are drivers most likely to hit in fatal collisions?
We examined 20 years of fatal crash data from the National Highway Traffic Safety Administration (NHTSA), to find out – exploring the more common sources of fatal crashes, such as collisions with rollovers/turns, pedestrians, and trees/shrubs. In the second part of our analysis, we are diving into the less frequent sources: the “other” category.
As previously mentioned, a fatal crash can involve multiple factors or events. Therefore, this analysis focuses on the “most harmful event” for each crash. According to the NHTSA, the most harmful event is defined as “the event that resulted in the most severe injury or, if no injury, the greatest property damage involving this vehicle.”
Between 2000-2019, there were 692,276 fatal motor vehicle crashes in the United States – with 14 percent involving “other” harmful events. Below we go more into detail.
Mailboxes are the most common fixed objects on roadways and the closest obstacle allowed next to the travel lanes. However, even though mailboxes are located everywhere in the country, mailbox-related fatal crashes were overwhelmingly clustered in the southeastern region.

Collisions with mailboxes are enough of an issue that both the Federal Highway Administration (FHWA) and the USPS have guidelines that recommend how to fix them and where they must be placed. Most importantly for safety, the FHWA recommendations cover the size of the post used, the depth that it is buried and the materials used. Essentially, they should be designed to bend or fall away if a vehicle hits them. However, looking at the map above that is not always the case.
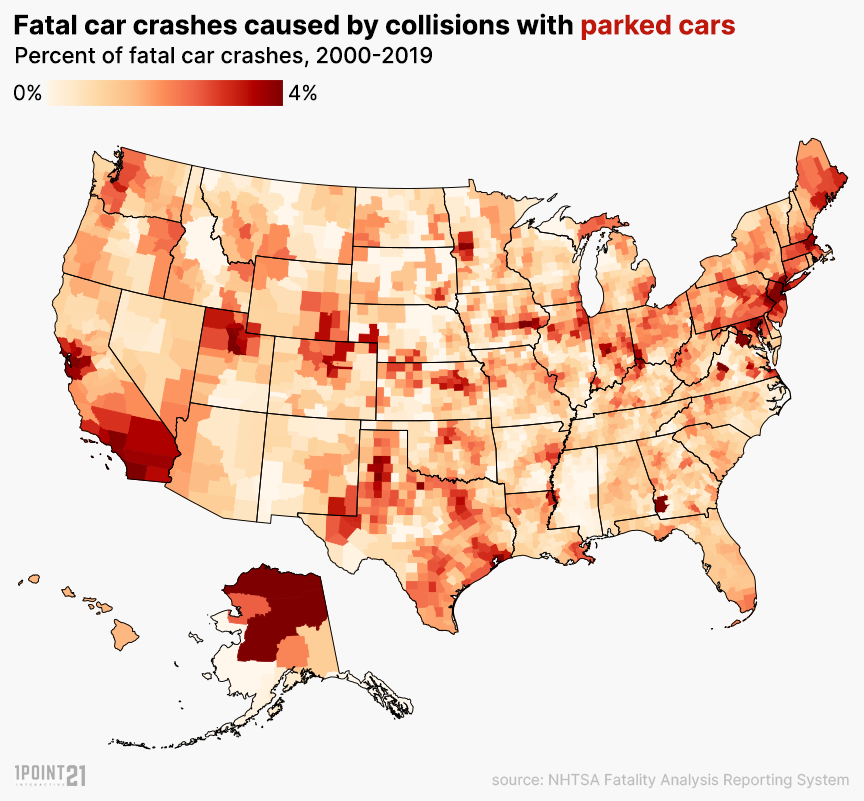
While we know that most fatal crashes involve one moving vehicle colliding into another, fatal crashes with parked cars can also be common – especially in states with densely populated areas like southern California and the Northeast. Interestingly, collisions with parked cars were also significant in Alaska.
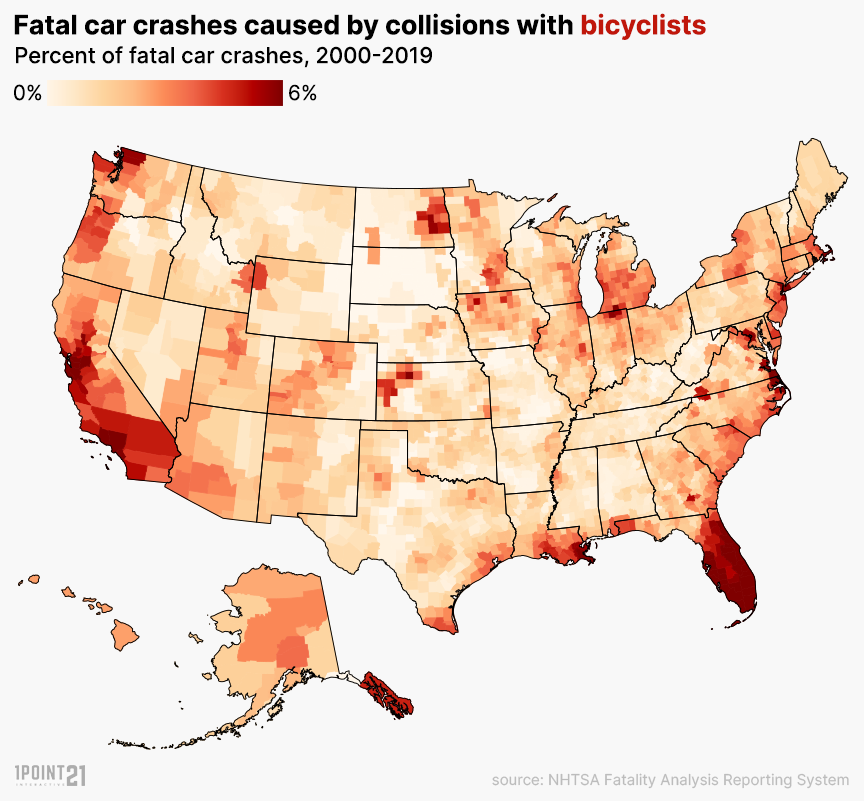
Fatal crashes involving bicyclists occur most in places with pedestrian-friendly and bicyclist-friendly weather, such as California, Florida, and Hawaii. Bicyclists, however, are extremely vulnerable on U.S. roadways and street design is overwhelmingly motor vehicle-centric.
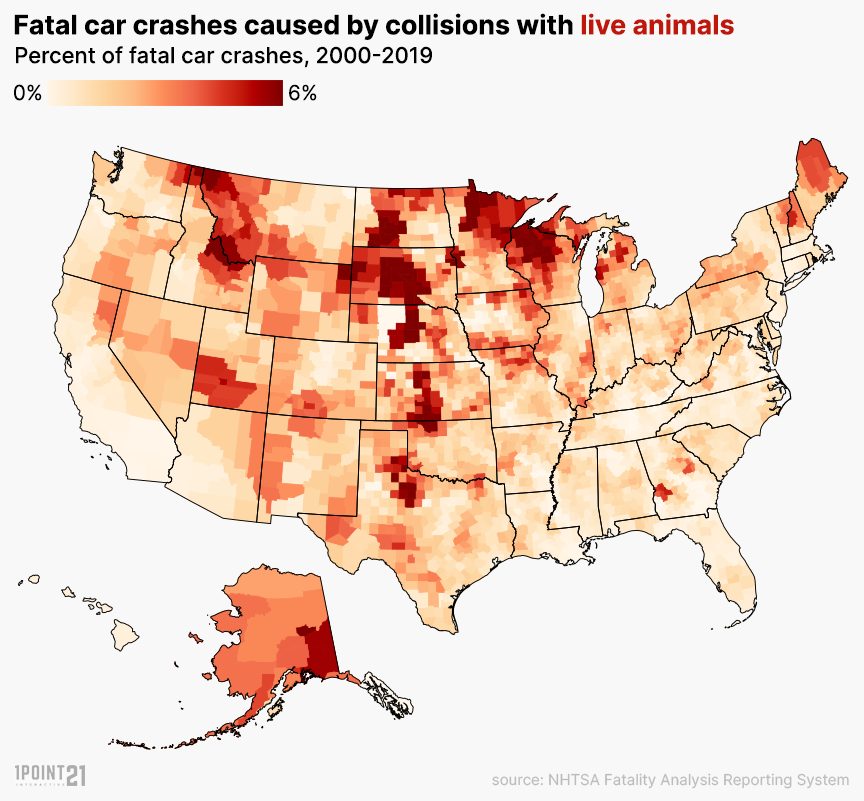
Fatal crashes involving collisions with live animals were most common in the midwest and northwest including North Dakota, South Dakota, Nebraska, Minnesota, and Wisconsin, but also areas within Texas Kansas, and unsurprisingly: Alaska. Animal-car collisions more frequently take place in high-speed, low-volume rural roads with a higher wildlife population and hunting popularity.
Wildlife-related vehicle crashes are also more likely to occur in the fall – when there is an increase in animal activity on roadways due to migration, mating, or hunting season and more driving in less daylight. According to the Federal Highway Administration (FHWA), the most commonly reported wildlife-vehicle collisions involve deer.
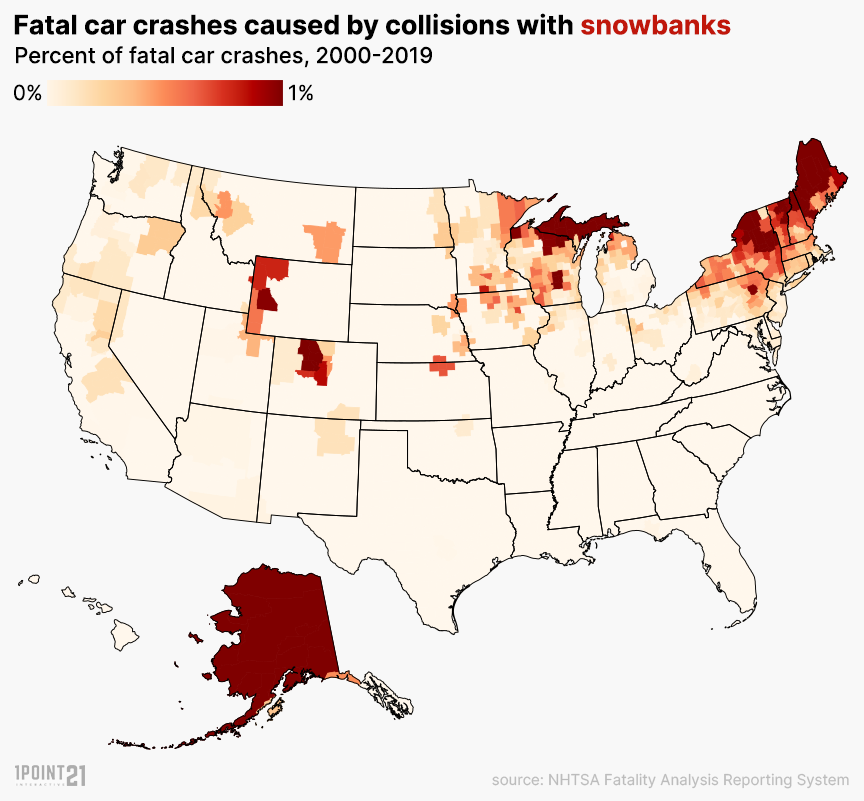
Fatal crashes caused by collisions with snowbanks occurred most often in Alaska, the northeastern states, New York, Vermont, and Maine, and portions of Colorado and Wyoming. Winter storms move through these states, forming snowbanks that can eventually get high enough to limit visibility for drivers. High snowbanks are dangerous, as they block the driver’s view of oncoming traffic when they are merging onto a roadway or entering an intersection – significantly increasing the risk of a collision.
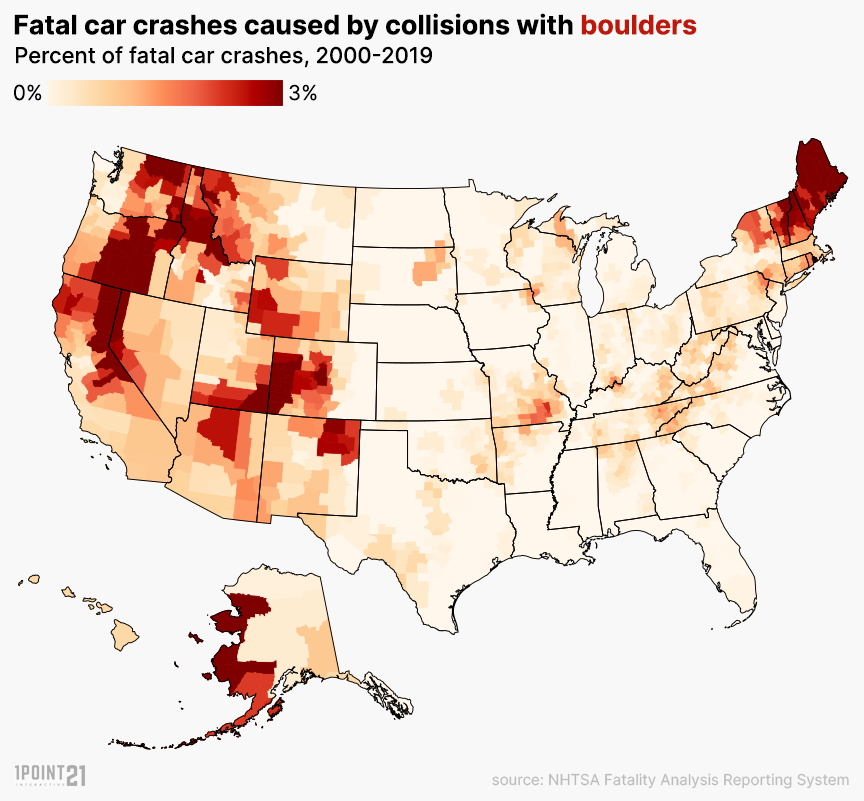
Fatal collisions with boulders were overwhelmingly clustered in the western states of Washington, Oregon, northern California, and Colorado, as well as Maine and New Hampshire.
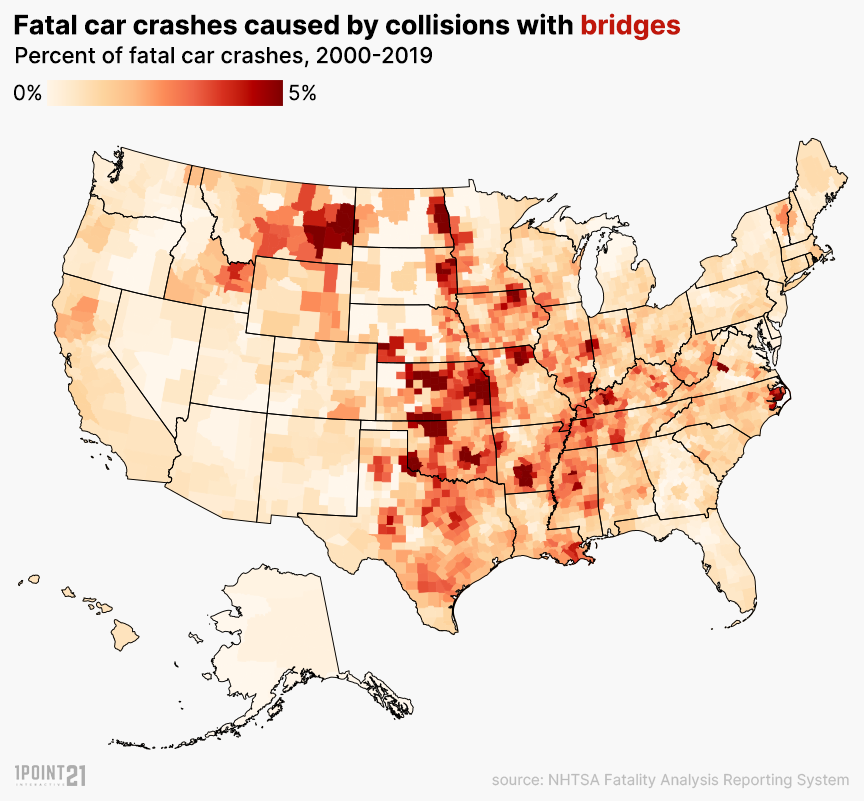
Fatal crashes caused by collisions with bridges most often occurred in the midwest and southern states including Kansas and Oklahoma, but also in Montana. Ice on bridges can contribute to bridge-related fatal crashes – especially in areas that aren’t equipped to drive in the snow and are speeding.
This study is based on 2000-2019 fatal crash data from the National Highway Traffic Safety Administration (NHTSA). If you missed the first part of our analysis, check it out here.
If you would like to report or republish our findings, please link to this page to provide a citation for our work.