In the first segment of our study on Arizona crash statistics, we explored the ages of drivers involved in crashes, gender and ages of passengers killed in accidents, types of vehicles involved in collisions, and more. Following up where we left off, we break down the statistics on crashes by Arizona county, nationwide accident statistics, and accident investigation expenditures by agency, amongst other features.
To instantly review the information at any point on this page, please click the appropriate link below.
Crashes By Arizona County in 2020
Fatal Accident Statistics in the U.S. in 2020
Seat Belt Survey, 2006-2019
What is “Buckle Up Arizona?”
Accident Investigation Expenses By Agency
Steps to Follow After a Car Accident
Arizona saw 98,778 total motor vehicle crashes in 2020, of which 970 resulted in fatalities. Maricopa led all Arizona counties in all crash statistics, from the number of collisions to the number of injury victims. In fact, a staggering 72.50% of the state’s crashes occurred in Maricopa County. Greenlee County experienced the least crashes, with only 69 total collisions (.07% of statewide accidents) and no fatalities.
| County | Number of Crashes | Fatal Crashes | Injury Crashes | Property Damage Only | Victims Killed | Victims Injured |
|---|---|---|---|---|---|---|
| Apache | 374 | 24 | 119 | 231 | 24 | 182 |
| Cochise | 909 | 21 | 267 | 621 | 25 | 393 |
| Coconino | 2,362 | 39 | 571 | 1,752 | 43 | 856 |
| Gila | 914 | 21 | 307 | 586 | 23 | 463 |
| Graham | 323 | 10 | 94 | 219 | 15 | 147 |
| Greenlee | 69 | 0 | 20 | 49 | 0 | 31 |
| La Paz | 343 | 16 | 98 | 229 | 17 | 165 |
| Maricopa | 71,611 | 460 | 19,997 | 51,154 | 492 | 28,855 |
| Mohave | 2,698 | 51 | 815 | 1,832 | 56 | 1,211 |
| Navajo | 1,162 | 31 | 316 | 815 | 38 | 453 |
| Pima | 8,841 | 150 | 3,041 | 5,650 | 162 | 4,267 |
| Pinal | 3,448 | 57 | 1,127 | 2,264 | 60 | 1,642 |
| Santa Cruz | 209 | 5 | 37 | 167 | 7 | 56 |
| Yavapai | 3,352 | 55 | 1,033 | 2,264 | 64 | 1,514 |
| Yuma | 2,163 | 30 | 768 | 1,365 | 31 | 1,115 |
| Total | 98,778 | 970 | 28,610 | 69,198 | 1,057 | 41,350 |
As of April 1st, 2020, Arizona was estimated to be the 14th most-populated state in the U.S., according to the United States® Census Bureau. Arizona’s estimated population at that time was 7,151,502 and the leading state, California, had an estimated population of 39,538,223. During that year, Arizona had both the 12th-highest death rate via car accident (per 100,00 people) and 12th-highest number of deaths of all states.
| State | Death Rate Per 100,000 People | Deaths |
|---|---|---|
| West Virginia | 122.2 | 2,242 |
| Kentucky | 87.5 | 3,950 |
| Tennessee | 86.5 | 6,107 |
| New Mexico | 85.5 | 1,853 |
| Louisiana | 79.4 | 3,711 |
| Ohio | 78.2 | 9,436 |
| South Carolina | 77.8 | 4,184 |
| Maine | 76.9 | 1,149 |
| Mississippi | 73 | 2,210 |
| Wisconsin | 71.5 | 4,682 |
| Delaware | 70.9 | 722 |
| Arizona | 69.1 | 5,398 |
| Pennsylvania | 69 | 9,565 |
| Missouri | 68.4 | 4,418 |
| Florida | 67.7 | 16,135 |
| Vermont | 67.1 | 7,379 |
| North Carolina | 67.1 | 481 |
| Indiana | 66.9 | 4,580 |
| Rhode Island | 65.6 | 787 |
| Alaska | 65.5 | 464 |
| Connecticut | 63.5 | 2,447 |
| Oklahoma | 62 | 2,628 |
| Montana | 61.9 | 729 |
| Colorado | 60.5 | 3,647 |
| Wyoming | 60.4 | 374 |
| Alabama | 59.6 | 3,006 |
| South Dakota | 58.5 | 569 |
| New Hampshire | 58.1 | 872 |
| Arkansas | 58 | 1,824 |
| Michigan | 56.8 | 6,097 |
| Massachusetts | 54.3 | 4,081 |
| Nevada | 53.5 | 1,761 |
| Kansas | 53.4 | 7,170 |
| Illinois | 53.4 | 1,698 |
| Minnesota | 52.6 | 3,319 |
| Virginia | 52.5 | 4,723 |
| Oregon | 52 | 2,458 |
| North Dakota | 51.9 | 430 |
| Washington | 51.3 | 4,216 |
| Idaho | 50.8 | 5,517 |
| Georgia | 50.8 | 967 |
| New Jersey | 50.3 | 4,761 |
| Utah | 49.4 | 1,461 |
| Iowa | 45.7 | 1,647 |
| Maryland | 44.4 | 2,948 |
| Texas | 44.2 | 12,919 |
| California | 44.1 | 18,357 |
| Nebraska | 42.3 | 903 |
| New York | 41.7 | 8,756 |
| Hawaii | 39.4 | 654 |
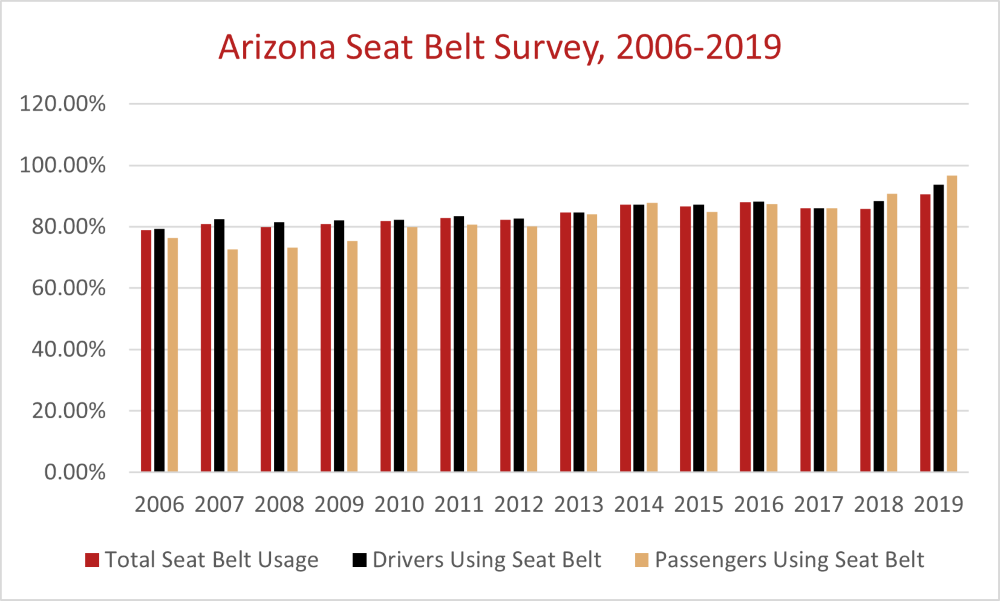
Every year, states are allocated a budget to perform an annual seat belt survey. The survey is aimed at providing better protection for drivers by improving seat belt usage statewide. In Arizona, the final percentages are used as performance indicators in the Highway Safety Plan and Annual Report. Due to the difficulties of gathering data with ongoing COVID-19 restrictions, Arizona took advantage of a special CARES ACT waiver to forego the 2020 seat belt survey. Instead, the state elected to use the previous year’s data as a stand-in for fiscal year 2020.
We plotted seat belt usage statistics in Arizona from 2006 through 2019 in the chart below. Overall seat belt usage in 2019 was at the highest it’s been over the selected timeframe, at 90.6%. This marks a 5.47% increase from 2018’s overall seat belt usage of 85.9%. Both drivers and passengers used a seat belt more frequently in 2019, which is an encouraging sign for the future.
In 2019, 214 traffic-related deaths occurred due to an unrestrained occupant. For years, states and the federal government have sought to reduce traffic-related fatalities by increasing seat belt and child safety seat usage. The Governor’s Office of Highway Safety (GOHS) in Arizona works to increase seat belt usage through education campaigns and statewide enforcement under the slogan “Buckle Up Arizona…It’s the Law!” Funding, including overtime funding, is provided to participating law enforcement agencies by the GOHS during related traffic enforcement campaigns.
Since 2017, the number of participating law enforcement agencies in Buckle Up Arizona has increased, rising from 24 to 27 in 2020. According to reports from law enforcement agencies, seat belt citations, DUI arrests, and moving violations all decreased from 2019 to 2020. The impact of COVID-19 on nonessential travel likely played a role in this substantial decrease.
| 2017 | 2018 | 2019 | 2020 | |
|---|---|---|---|---|
| Number of Participating Agencies | 24 | 26 | 27 | 27 |
| Seat Belt Citations | 2,083 | 2,141 | 1,974 | 1,199 |
| Child Restraint Citations | 119 | 148 | 113 | 65 |
| DUI Arrests | 268 | 294 | 274 | 94 |
| Felony Arrests | 483 | 603 | 757 | 103 |
| Stolen Vehicles | 316 | 305 | 364 | 69 |
| Warrants Cleared | 1,285 | 1,483 | 1,807 | 107 |
| Suspended Licenses | 456 | 479 | 406 | 217 |
| Uninsured Motorists | 961 | 1,083 | 1,241 | 511 |
| Moving Violations | 4,057 | 5,481 | 5,936 | 3,796 |
| Reckless Driving Citations | 13 | 13 | 28 | 30 |
| Drug Arrests | 488 | 547 | 655 | 28 |
| Other Misdemeanor Arrests | 1,457 | 1,716 | 1,911 | 355 |
The state of Arizona budgets for accident investigation resources, training, and assets on an annual basis. Law enforcement agencies in larger metropolitan areas are generally awarded more funding, since they require a larger task force and more assets than their smaller counterparts. The Maricopa County Sheriff’s Office (CSO) received the largest amount of obligated and actual funds of any individual county agency, at $45,000 and $42,185, respectively.
| Planned Activities | Grantee | Funding Source | Funds Obligated (2020) | Funds Spent (2020) |
|---|---|---|---|---|
| Accident Investigation Overtime | Buckeye PD | Sec. 402 | $17,490 | $11,513.88 |
| Accident Investigation Overtime | Maricopa CSO | Sec. 402 | $45,000 | $42,185 |
| Accident Investigation Equipment / Materials & Supplies | Chandler PD | Sec. 402 | $7,300 | $7,150 |
| Accident Investigation Equipment / Materials & Supplies | Mohave CSO | Sec. 402 | $16,132 | $15,176.82 |
| Accident Investigation Equipment / Materials & Supplies | Surprise PD | Sec. 402 | $42,220 | $39,542.10 |
| Accident Investigation Equipment / Materials & Supplies | AZ DPS | Sec. 402 | $72,000 | $72,000 |
| Accident Investigation Equipment / Materials & Supplies | Eloy PD | Sec. 402 | $21,835 | $21,835 |
| Accident Investigation Equipment / Materials & Supplies | GOHS Traffic Crash Investigation Support Program | Sec. 402 | $33,531 | $33,531 |
| Accident Investigation Training / Supplies | Apache Junction PD | Sec. 402 | $8,160 | $3,585 |
| Accident Investigation Training / Supplies | Gilbert PD | Sec. 402 | $2,500 | $0.00 |
| Accident Investigation Training / Supplies | Glendale PD | Sec. 402 | $19,325 | $18,444 |
| Accident Investigation Training / Supplies | Mesa PD | Sec. 402 | $21,009 | $19,184 |
| Accident Investigation Training / Supplies | Tempe PD | Sec. 402 | $15,360 | $4,715.00 |
| Accident Investigation Training / Supplies | Tucson PD | Sec. 402 | $24,645 | $23,399.85 |
| Accident Investigation Training / Supplies | Casa Grande PD | Sec. 402 | $7,355 | $6,508 |
| Accident Investigation Training / Supplies | GOHS Traffic Crash Investigation Training Courses | Sec. 402 | $65,469 | $23,000 |
To wrap up our article, we want to provide a brief guide on the steps to take if you are involved in a collision. We understand that even a minor wreck can be incredibly stressful and encourage you to stay calm and follow these guidelines.
https://azdot.gov/sites/default/files/media/2021/07/2020-crash-facts.pdf
https://www.nhtsa.gov/sites/nhtsa.gov/files/documents/az_fy2020_ar_1.pdf